Power vs. Heart Rate: Which is Better?
- By Matt Pacocha
- Published: 23 ene 2023
- Last Updated: 24 ene 2023

Why train with power or heart rate?
Adding any amount of activity to your day contributes to your health. But something fascinating happens when you add a fitness metric, like heart rate or power output, to your workouts. Suddenly a walk around the block, or a twenty-minute indoor cycling ride counts for something more. By adding a form of fitness tracking to your workout, you’ve transformed a qualitative experience into a quantitatively enhanced one, and you’ve also discovered a tangible way to reinforce fitness habits, track your progress, and measure the intensity of your workouts.
What’s the difference between training with power and heart rate?
Power vs. heart rate at a glance:
- Power accurately measures how hard you are working, while heart rate measures your body’s response to the workout.
- Any increase in effort instantly elevates power data, whereas heart rate data is slower to respond to a heightened effort.
Heart rate is easily influenced by things that influence the body, like temperature, hydration level, fatigue, stress, and caffeine. Power output is only influenced by effort. To achieve a higher wattage during a ride, you must either increase your cadence at a given resistance or keep your cadence the same and increase resistance; either method will result in higher output and an increase in speed. - Both power and heart rate helps you train more effectively by using training zones. Heart rate zones and power zones enable your workouts to become more personalized, purposeful, and productive. Keep reading to learn how.
How to train with heart rate
Heart rate is a gold standard in fitness tracking and it’s a powerful way to gauge how your body is responding to a particular workout. Much like power data, heart rate training provides guidance on if you are working in the sweet spot of your effort, or if you are pushing too hard or taking it too easy. All that you need to get started is a heart rate monitor, like a smartwatch or wearable.
Heart rate is measured in beats per minute (bpm) and heart rate zones (HR zones) create the framework for heart rate training. We all have a personal resting heart rate (the number of beats per minute your heart does while you’re resting) and a maximum heart rate (the greatest number of times your heart can beat in a minute). And in between these values are different HR zones that correspond to training intensity and training benefit.
What are the five heart rate zones?
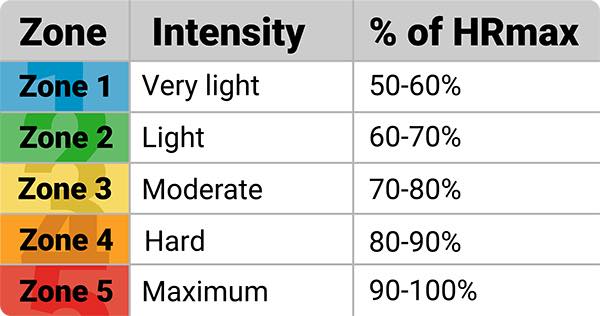
There are five heart rate zones that are expressed as a percentage of a person’s maximum heart rate. Your training plans should include workouts in all five zones. The HR zone chart below shows the level of intensity and percentage of maximum heart rate used in each one.
What are the benefits of training in each heart rate zone?
Zone 1 (Very Light) 50-60% of HR Max
This is a very low-intensity zone. Training at this intensity will boost recovery and will prepare you to train in the higher heart rate zones. This is the zone used during warmup and cool down, or during recovery activity.
Zone 2 (Light) 60-70% HR Max
Exercising in zone 2 feels steady and light. You should be able to maintain this intensity for a long time. Zone 2 is all about improving endurance and it should be an essential part of every exercise program. This zone helps your body become more efficient at oxidizing (burning) fat and increases muscular fitness and capillary density.
Zone 3 (Moderate) 70-80% HR Max
Working out in HR zone 3 is especially effective for improving the efficiency of blood circulation in the heart and skeletal muscles. Training in this zone makes you strong and efficient, and it’s also the zone where lactic acid picks up in the bloodstream.
Zone 4 (Hard) 80-90% HR Max
HR zone 4 is where things start to get uncomfortable. Breathing is fast and open-mouthed and you are training aerobically. Training at this intensity will improve speed and endurance and your student’s bodies will become more proficient at using carbohydrates for energy. This zone will also condition the body to withstand higher levels of lactic acid in the bloodstream for longer.
Zone 5 (Maximum) 90-100% of HR Max
HR zone 5 is all about maximum effort. The heart, blood, and respiratory system will be working at full capacity. Lactic acid will build up in the bloodstream quite quickly and you will not be able to continue at this intensity for long. Interval training can bump you into this zone, but it is not safe to stay here for long.
How do I estimate my maximum heart rate?
You will need to know your maximum heart rate in order to start training with heart rate. To estimate your maximum heart rate, use this simple equation.
Max HR = 220-Age
How to train with power
First things first, let’s define what power is!
The science behind all of this is pure physics, but in a nutshell, power is the combination of how much work a cyclist has done and how fast they’ve done it.
You’ll need to attach a power meter to your bike in order to train with power. This small device captures the precise amount of work, or energy, that’s put into a ride by measuring how hard (torque) and how fast (cadence) a cyclist is pushing on the pedals to keep them turning. This combined measurement is expressed in watts and is often referred to as power output.
Power output varies considerably from person to person, so comparing power variables from one rider to another isn’t fruitful. But knowledge is power for the individual rider, and power-based data provides individuals with a brilliant perspective of what their bodies can do. In addition to quantifying effort during a given workout, tracking power output can also help riders set quantifiable goals and measure improvements in their fitness level.
The data that’s collected from each workout can be used to build training protocols and individualized power zones. Power zone training utilizes a rider’s functional threshold power (FTP) to establish personalized watt ranges (zones). Riding in each zone affects the body in unique ways and allows instructors (and riders) to purposefully target specific exercise intensities (like active recovery, endurance, tempo, threshold, V02 max, and anaerobic) while avoiding overtraining.
What is functional threshold power (FTP)?
FTP is a rich and essential element in power training. Refined by power authority Dr. Andy Coggan, FTP is an estimation of the amount of work you are able to do for approximately one hour. It serves as the basis for a lot of important metrics (e.g. TSS, CTL, ATL, TSB, etc.), but most importantly, the Threshold Power value serves as the cornerstone to setting up training zones.
We’ve dedicated an entire blog to helping you learn how to get the best results out of your FTP test. Check out our How to Test Threshold Power blog to learn more.
What are the power zones?
Power zones are calculated based on a percentage of your Functional Threshold Power (FTP) and are commonly used for workout targets in order to give a range of intensity for an interval.
The comes preloaded with three options for calculating power training zones based on FTP: Stages (six power zones), Coggan (seven power zones), or Automatic. We’ll go into more detail about the Coggan method below.
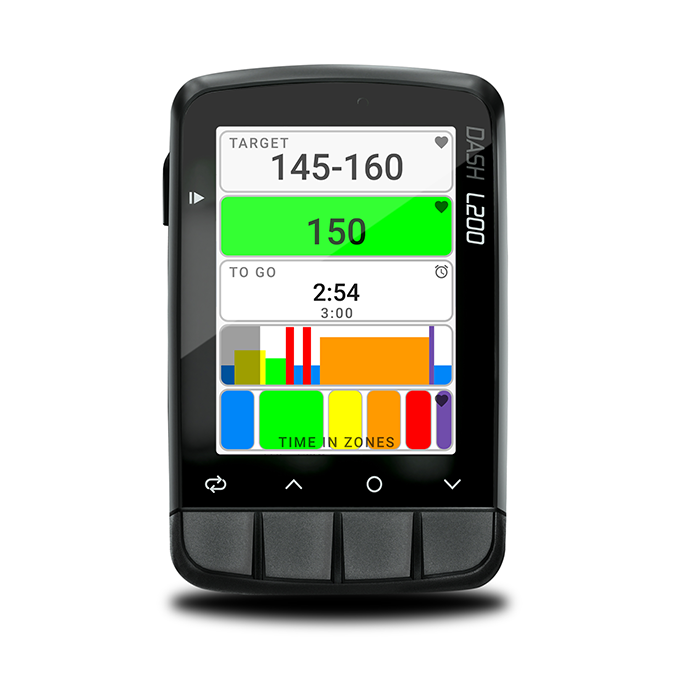
To update your zone calculation preference on your Dash head unit, go to: Settings > User Settings > Power zones > Method.
If you select Automatic Zones, the Dash will automatically detect your FTP based on your rides. Your zones will be automatically updated to reflect your new FTP.
What are the seven Coggan power zones?
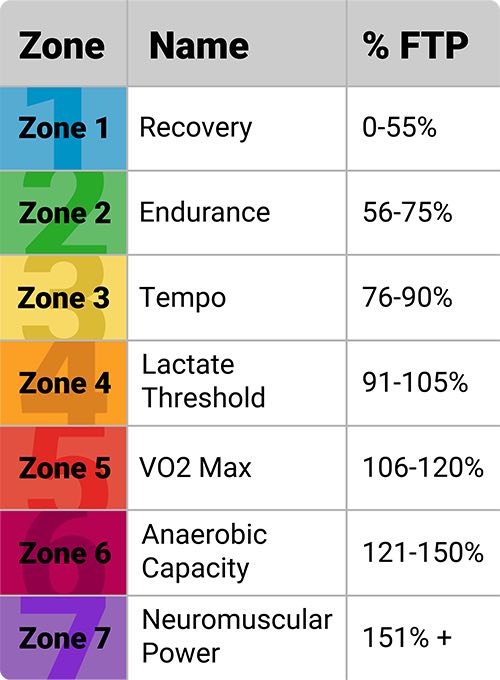
There are seven power zones that create the framework for most power training. The chart below shows the level of intensity and percentage of FTP used in each one.
What are the benefits of riding in each power zone?
Zone 1 (Active Recovery) 0-59% of FTP
Riding in this zone offers subtle benefits, such as improving circulation and stimulating the transport of nutrients to the muscles. It also helps to reinforce movement patterns and can be used to add time in the saddle without creating much muscular or metabolic stress. In training, Active Recovery is mostly used for rest intervals between hard efforts, allowing you to catch your breath, lower your heart rate, and clear waste products from your muscles
Zone 2 (Endurance) 60-79% of FTP
Zone 2 stimulates more adaptation and creates a bit more fatigue than riding at a recovery pace. Still, this intensity level is sustainable for a very long time, as its name indicates. Endurance rides increase the mitochondrial density, capillarization, and aerobic enzyme content of muscles, all of which work to improve your aerobic capacity. The body is able to utilize fat for fuel at this intensity, and the ability to do so becomes more efficient over time. Endurance pace forms the bulk of most long rides, and during any mass-start event, you’ll spend lots of time here while sitting in the pack. In a training plan, Endurance rides are a great way to reinforce movement patterns and add training stress without adding much fatigue.
Zone 3 (Tempo) 80-90% of FTP
Tempo is still primarily aerobic, but riding at this intensity begins to recruit some Type IIa muscle fibers. This is the first zone that feels challenging to sustain over long periods as it adds some muscular endurance demands. Tempo stimulates many of the same adaptations as endurance riding but with more pronounced effects, particularly in improving the abilities of the muscles to store glycogen. The fatigue created by riding for long periods at Tempo is much higher than at Endurance pace, but still relatively low.
Zone 4 (Threshold) 91-104% of FTP
Riding at threshold is highly glycolytic, shifting fuel demands from fat to sugar. It activates a large volume of type IIa muscle fibers and places significant stress on muscular endurance. Riding in this zone helps to increase blood plasma volume, increase mitochondrial enzymes, and improve the ability to maintain high intensities for long periods. It also generates significant fatigue. While theoretically a pace you could sustain for an hour, in practice most athletes find riding at threshold quite uncomfortable for any longer than about 20 or 30 minutes at a time.
Zone 5 (VO2 Max) 105-120% of FTP
The term VO2 Max refers to the maximum amount of oxygen your body is able to utilize during exercise. This zone encompasses high intensity efforts that push the cardiorespiratory capacity to its limit. Riding at VO2 Max places a high demand on both aerobic and anaerobic capacities. It stimulates cardiac remodeling, improving the strength and stroke volume of the heart, and significantly increases blood plasma volume. VO2 Max efforts are highly fatiguing and can only be sustained for several minutes.
Zone 6 (Anerobic) 121-150% of FTP
These very high efforts are higher-force and shorter duration, activating energy systems that can only be sustained for minutes, at most. Riding in the Anaerobic zone improves lactate tolerance and increases the body’s ability to utilize anaerobic energy stores, thus raising the ceiling of your fitness.
Zone 7 (Nueromuscular Power) 151+% of FTP
All-out maximal efforts, lasting just a few seconds during a hard sprint, further challenge the neuromuscular system and improve the ability to recruit available muscle. These efforts have a much higher strength demand than other cycling intensities and are the most rapidly fatiguing and least repeatable.
Is it better to follow heart rate or power metrics?
Training with heart rate and power are two different approaches to monitoring and measuring your exercise intensity. Measurements of heart rate and power are unique, in that power is the measurement of the mechanical work that is being performed (on a Stages Power meter) at the crank arm, while Heart rate is the measurement of your body’s response to that work. Heart rate can vary from day to day. Temperature, hydration level, fatigue, stress, caffeine, and other factors can easily influence your heart rate, which makes it difficult to quantify the intensity of your efforts.
Power, on the other hand, does not fluctuate and can add a concrete crosscheck to workouts. Power meters generate solid metrics that communicate the pure effort (mechanical response) of a workout. A watt is a watt, regardless of whether you’re hyped up on caffeine or suffering from a sleepless night. The only way to influence power output is to put in the work. Any increase in effort instantly elevates power data, whereas heart rate data is slower to respond to a heightened effort. The accuracy, responsiveness, and consistency of power metrics can help you figure out what works best for your body both, in the moment and over time.
What is rate of perceived exertion (RPE)?
We’re adding Rate of Perceived Exertion (RPE) into the mix as a measurement because the way a workout feels is equally, if not more important, than the metrics you collect and analyze from your heart rate monitor or power meter. RPE is a subjective (rather than an objective) measurement of how hard you feel like your body is working. It ranges from 0 to 10, with 0 being no exertion and 10 being maximum exertion.
Thanks to modern technology, we have devices like the and the that work in concert to measure, record, and display heart rate and power values. RPE, on the other hand, isn’t recorded anywhere except an athlete’s awareness. It’s a real-time assessment of how things are feeling as you progress through your workout. The descriptions below are based on the Modified Borg Scale.
Level 1-2 (Very Light Intensity)
Activities in levels 1-2 include normal light activities, like reading, driving, and folding laundry. Breathing does not change, speaking is effortless, and you might be moving, but it doesn’t feel like work.
Level 3-4 (Light Intensity)
Movements at this level feel like you could maintain them forever. Warm up, recovery and cool down intensities fit well at this level. It’s easy to carry on a conversation and it feels like you are putting forth light effort.
Level 5-6 (Moderate Intensity)
You can maintain the intensity of your workout at level 5 or 6 for hours. Your breath is present and active and your effort is hard, but not too hard. You can carry on a conversation, but it requires some effort.
Level 7 (Vigorous Intensity)
You’ll start to feel uncomfortable when you are working in level 7. Work is noticeable in both cardiovascular and muscular systems, and holding a conversation is possible, but it will cause you to become out of breath.
Level 8 (Hard Intensity)
You are doing hard and uncomfortable work at level 8. You can only maintain this intensity for a few minutes and you will be breathing hard. Conversations consist of two to three word sentences.
Level 9 (Very Hard Intensity)
Level 9 activities are not sustainable. You can only speak one word at a time, and you’ll be breathing very hard.
Level 10 (Maximum Intensity)
You can only keep level 10 pace up for a few seconds. The unsustainable level of work leaves you completely out of breath and unable to converse while moving.
Should power and heart rate zones match up?
It’s not uncommon to have some discrepancy between your heart rate and power zones. The zones do overlap some of the time, but both sets of zones tend to fluctuate due to the constantly changing interplay between environmental factors, degree of fitness, level of fatigue, and the comprehensive health of the body.
In a real-world indoor cycling class, for example, it’s not uncommon for there to be a disconnect between heart rate and power. Most indoor cycling classes are designed with short, intense intervals with short recovery periods. The temperature can climb in a crowded indoor cycling class which elevates heart rate and increases your perceived effort. In this situation, your heart rate probably won’t match up with your power output, but instead, are more reflective of the environment and training style. In this case, you can learn the most about your workout by using power output as the primary driving metric with RPE as the strong, second metric.
Which is better, heart rate, power, or rate of perceived exertion?
In short, they all have value and they work well together. FTP (power output metrics), RPE, and heart rate can vary from day to day. After all, we are flesh and blood, not robotic machines.
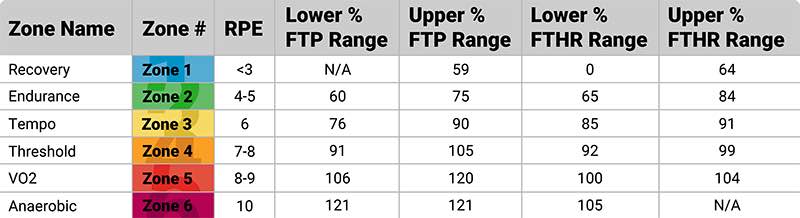
The chart below illustrates how the combination of subjective (RPE) and objective (heart rate and power output) create a comprehensive picture of your workouts.
At the end of the Day
No one metric can give you a complete picture of what’s happening during a workout.
Combining multiple streams of information communicates the most about what’s truly happening during a workout.
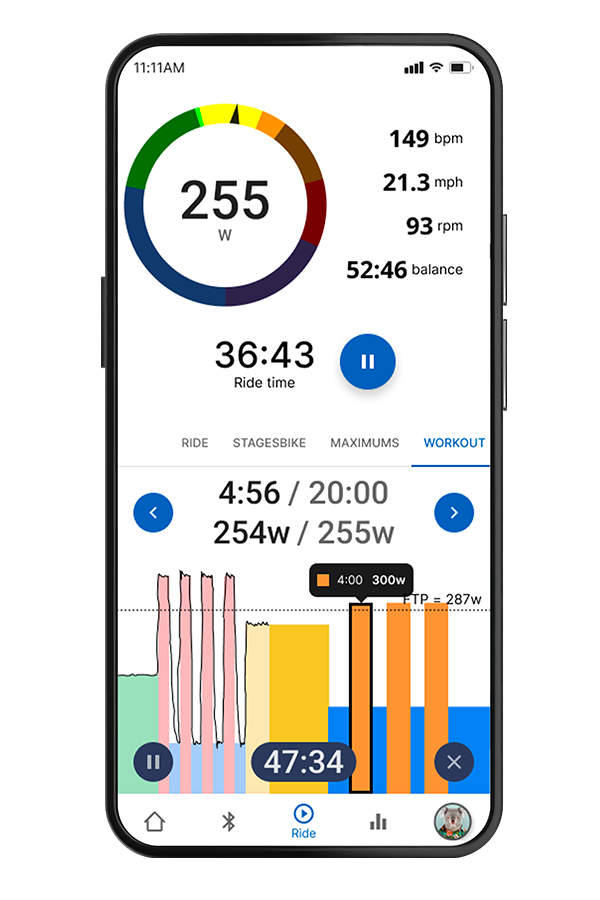
The new makes managing and analyzing your workouts easy. The app displays your heart rate, power output, cadence, calories, and distance in real time, and all on one screen. You can also access summary data, like time spent in zones, peak power, historical insights, and ride graphs to help you gain a complete picture of all of your training data.